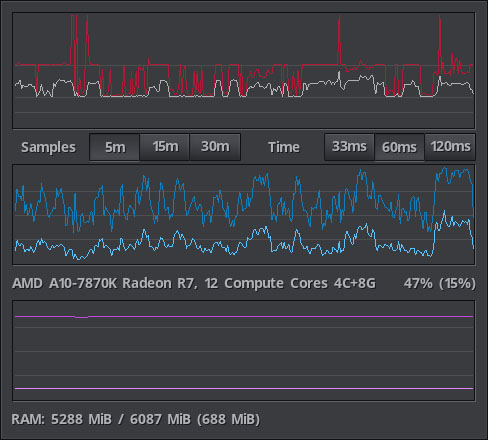
The FPS tab contains three graphs, at the top is the FPS graph that shows how many milliseconds has the game been using to render frames.
In the middle is the CPU graph that shows the cpu usage by the whole system as well as the game's cpu usage.
At the bottom is the RAM graph that shows system and game's physical RAM usage.
The three together work on the same time scale at once and are a fairly good way of looking at game and system's performance and the temporal correlation between particular events.
The whole graph system has been redesigned anew for version 4.x of the fpsc, given more precision but most of all a much more lighter use of system resources and flexibility.

What the FPS graph shows is time in milliseconds, each second. It goes from bottom to top, 0ms to 120ms, the width of the graph shows the samples taken every second in the configured time span.
There are two kinds of information on the FPS graph, the average millisecond per second, in the picture as white-ish color and the maximun time in milliseconds it took to render a frame during that second shown in red.
The grey lines represent where inside the FPS graph are, bottom to top, 120fps (8ms), 60fps (16ms) and 30fps (33ms).
Samples sets the actual sampling size of all the graphs in minutes, and so the average values will only take those last minutes into consideration as every second could be thought of as a sampling slot and a new sample always overwrites the oldest one. Ranges are 5 minutes (300s), 15 minutes (900s) and 30 minutes (1800s).
Time determines the height of the FPS graph to be shown, 33ms will show a graph of values between 1000 and 30 fps, 66ms will top out at 16 fps and 120ms at 8fps.
The CPU graph shows the cpu's percent system usage as darker blue and the game's percent usage as a clear blue line tone.
Below the cpu graph is the actual description of the cpu that comes directly from the processor, and next to it are the numerical values of the current percentual usage, the actual game's usage is the one inside parentheses.
The RAM graph shows the physical ram usage of the system as darker pink color and the game's usage as a clear pink line tone.
Below the ram graph is the current total system usage and the total physical ram available, the current game's ram usage is the one inside parentheses, all values are in megabytes.


